In addition to the Protection Dashboard on the Summary page of the Cloud Protection app, WithSecure provides out-of-the-box Dashboards and Reports for you to further analyze your Salesforce environment. There are over 25+ reports in the WithSecure Cloud Protection Reports folder, and three dashboards in the WithSecure Cloud Protection Dashboards folder.

WithSecure Cloud Protection Dashboards:
- File Protection Details:
- File Alerts by Severity
- File Threats Handled
- File Threats Handled by Location
- File Threats Handled by Type
- File Threats Handled by User
- Top File Threats (Infections)
- URL Protection Details
- URL Protection Alerts by Severity
- URL Threats Handled
- URL Threats Handled by Location
- URL Threats Handled by User
- Top URL Categories
- Protected Content Analytics
- File Content by File Type
- File Content by Location
- URL per Category
- URL by Location
- File Uploads
- File Downloads
- URL Posts
- URL Clicks
- URL Events by User
- Threat Intelligence Events
- File Events by User
- Protected Users
- Active File Protection Users
- Active URL Protection Users
- Blocked threats – Top Sources
Custom Reporting
To create custom reports for File and URL events, you can create reports of the following Report Types:
- File Scan
- File scan events
- Usage Statistic
- Summary statistic data, including File Uploads, File Downloads, URL Posts, URL Clicks, and Dates
- Alerts
- Report on system alerts
- Exclusions
- Report on File and URL scanning exclusions created in your org.
- URL Scan
- URL scan events
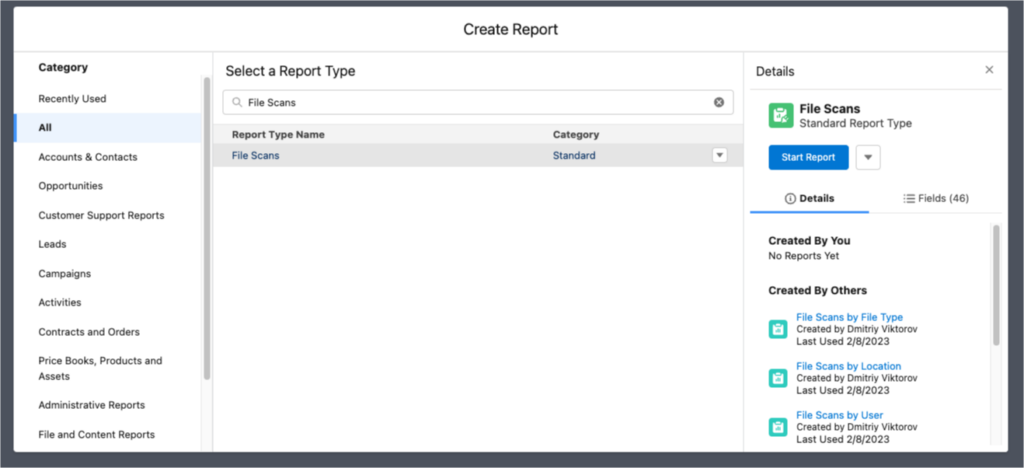
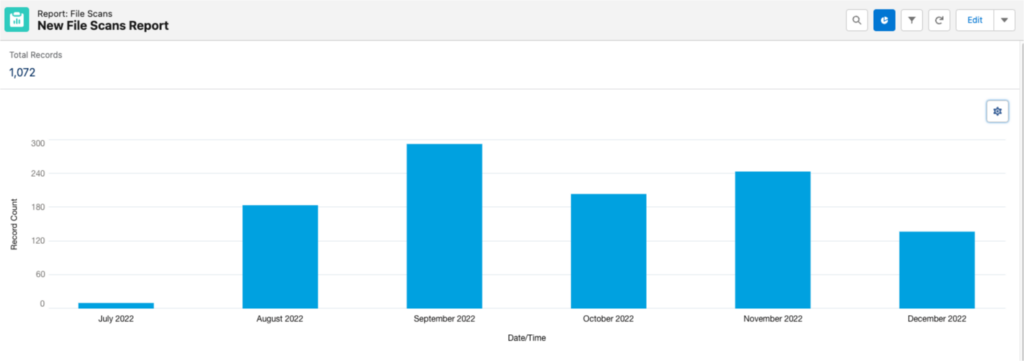
Example 1: To report on the number of file scans that took place each month during the previous calendar year, follow the steps below:
- Create a new report, select File Scans at the report type.
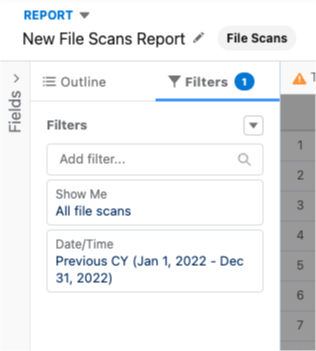
2. Adjust the filters to show ‘All file scans’ and set the desired Date/Time timeframe.
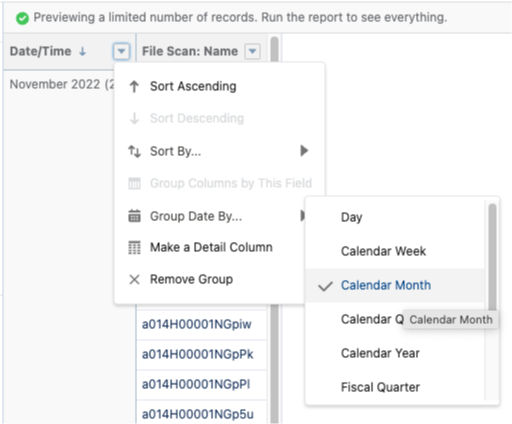
3. Group rows by the Date/Time field, and then adjust the ‘Group Date By…’ field to the desired interval.
4. Run and save your report, adjust the chart to your desired settings
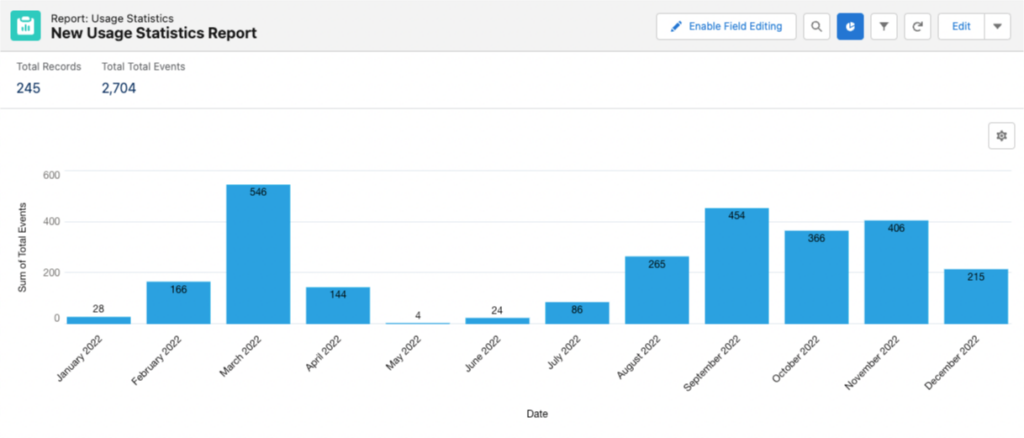
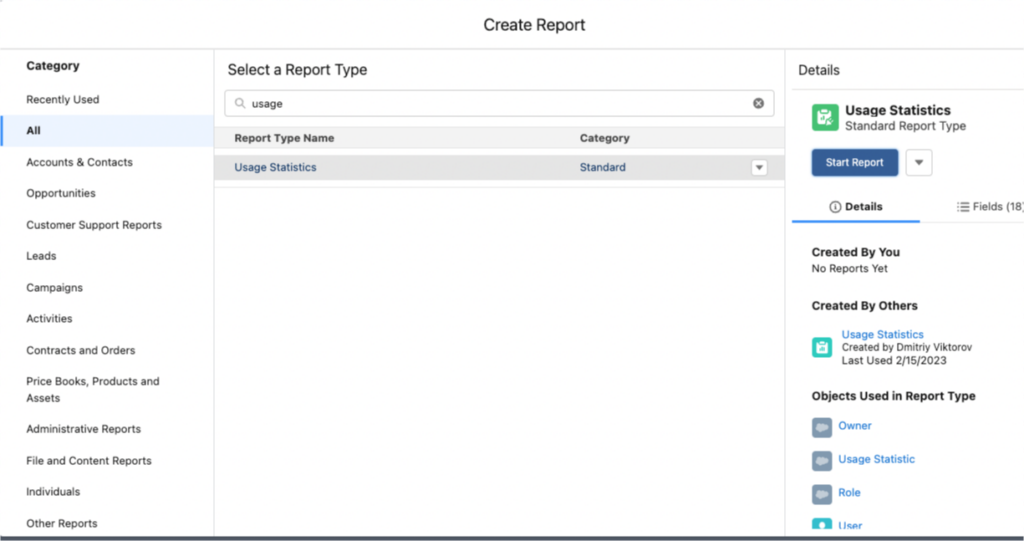
Example 2: To report on the number of file and URL scans that took place each month during the previous calendar year, follow the steps below:
1. Create a new report, select Usage Statistics at the report type.
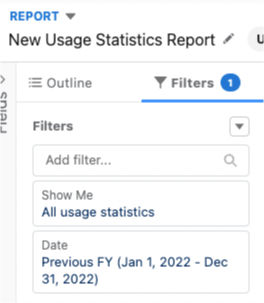
2. Adjust the filters to show ‘All usage statistics’ and set the desired Date/Time timeframe.
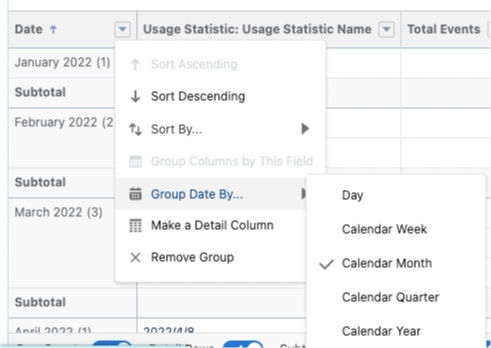
3. Group rows by the Date field, add ‘Total Events’ to the displayed columns, and then adjust the ‘Group Date By…’ field to the desired interval.
4. Run and save your report, adjust the chart to your desired settings.